Incident Knowledge
Incident Knowledge turns your past incidents into a living knowledge base. It automatically detects recurring bug patterns across pull requests by learning from your incident history — so your team can catch issues before they reach production again.
How it works
- Connect an incident management or observability platform (Sentry, PagerDuty, Datadog, etc.)
- Map the incident sources from that platform to your GitHub repositories
- Entelligence ingests your historical incidents and analyzes your pull request history
- The system surfaces recurring patterns on every new PR review
Supported integrations
Incident Knowledge supports the following platforms as incident sources:
| Platform | Type | Notes |
|---|---|---|
| Sentry | Error tracking | Connects via a project auth token |
| Datadog | Observability / APM | Connects via an API key + App key |
| New Relic | Observability / APM | Connects via a license/ingest key |
| BetterStack | On-call & uptime | Connects via a personal access token |
| PagerDuty | On-call / incident management | Connects via an API key |
You need at least one connected platform to enable Incident Knowledge. Multiple platforms can be connected simultaneously.
Onboarding: step-by-step setup
Prerequisites
- Your organization must have the Incident Knowledge feature flag enabled. Contact your Entelligence account manager if you don't see it.
- You need admin-level access to your incident platform to generate API credentials.
- Your repositories must already be connected to Entelligence with the PR Bot installed.
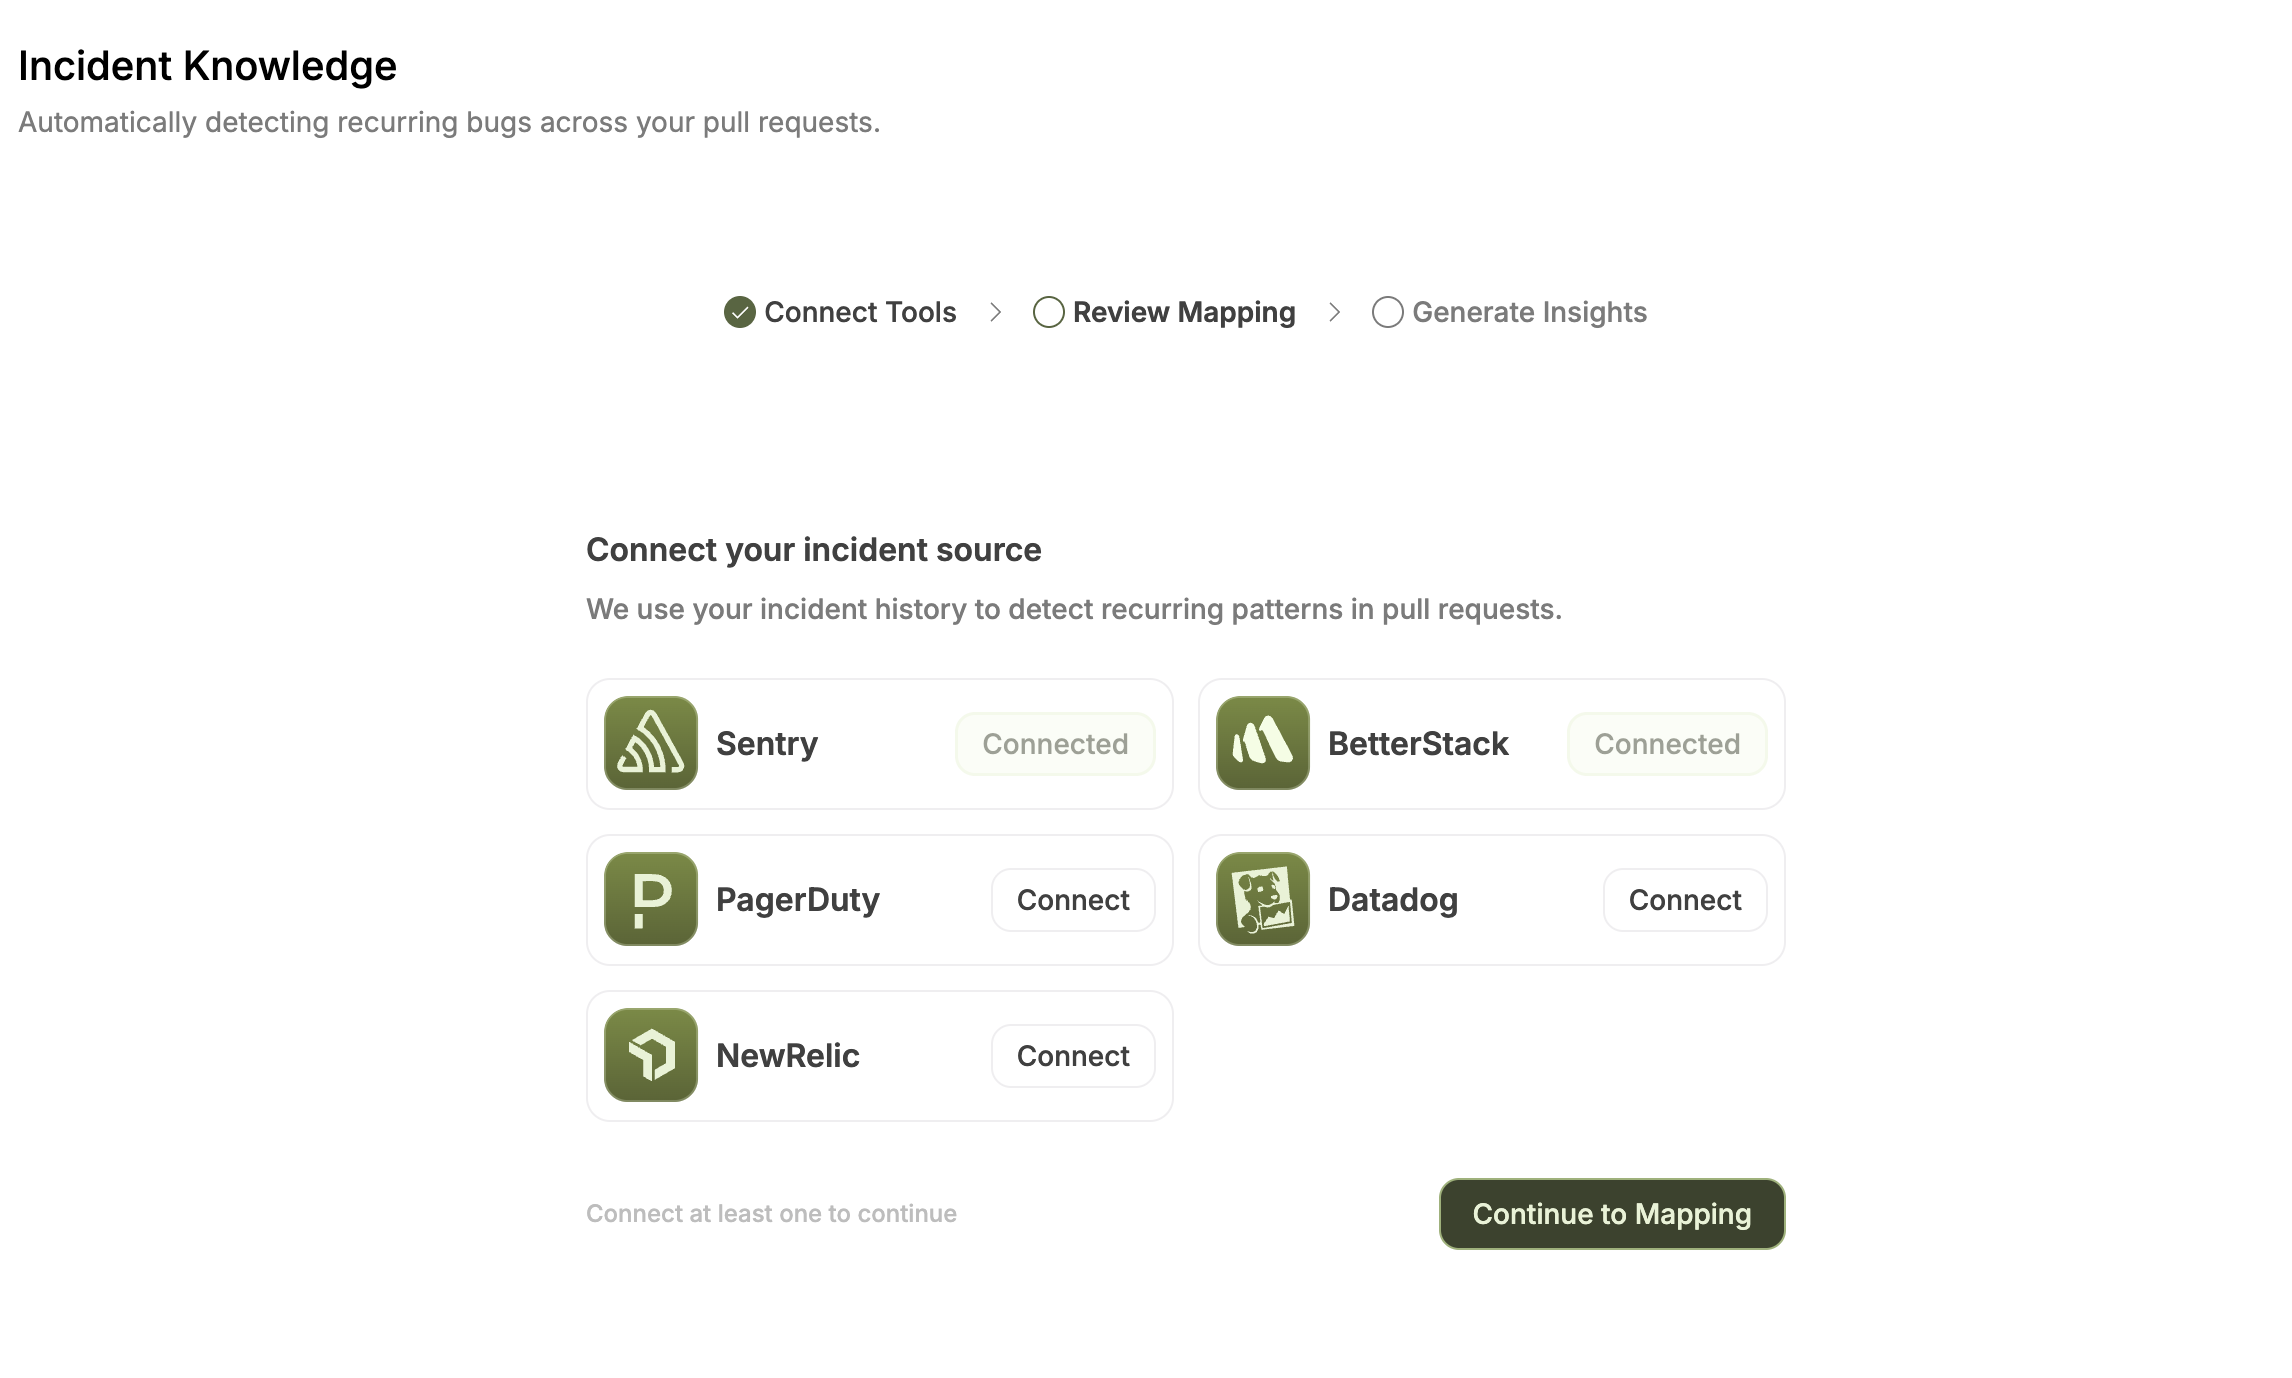
Step 1 — Connect your incident source
Navigate to Incident Knowledge in the sidebar. If you haven't configured it yet, you will land on the setup wizard.
Click Setup Incident Tracking, then choose one or more platforms to connect:
How to generate a Sentry auth token:
- Go to sentry.io (opens in a new tab) → Settings → Account → API → Auth Tokens
- Click Create New Token
- Select the scopes:
project:read,event:read,org:read - Copy the token and paste it into the Sentry modal in Entelligence
The token is stored securely and used only to read your incident history.
Once connected, the platform card will show a Connected badge. Click Continue to Mapping to proceed.
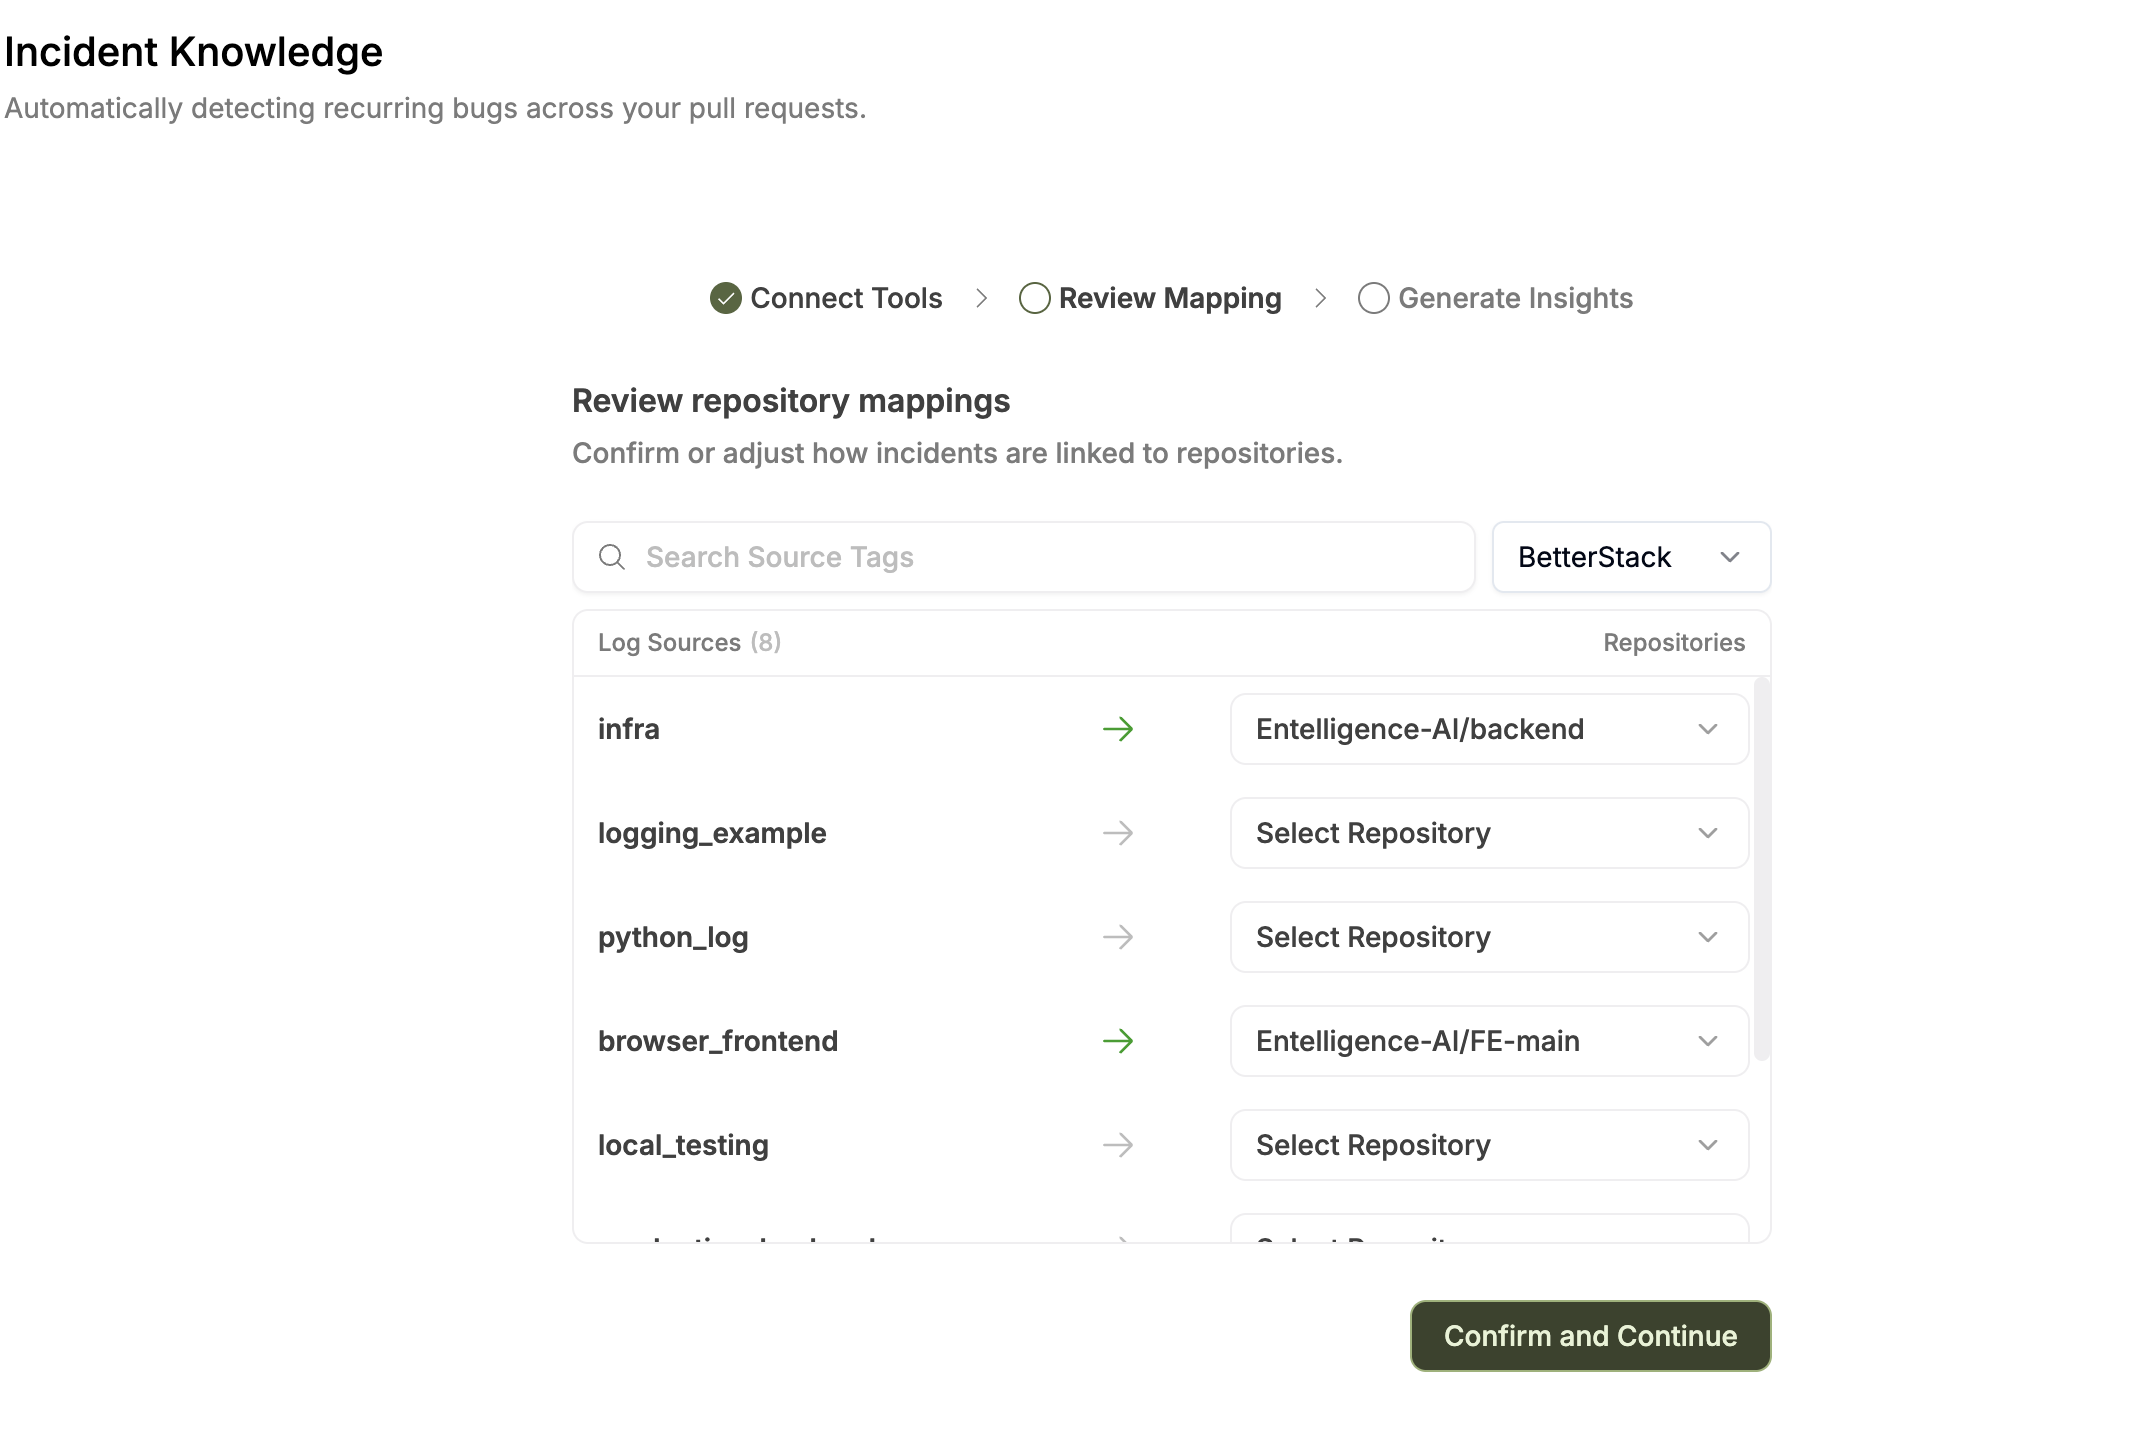
Step 2 — Map incident sources to repositories
After connecting a platform, Entelligence fetches all the log sources (projects, services, monitors, etc.) from that platform and asks you to map each one to a GitHub repository in your organization.
This mapping is how the system knows which incidents are relevant to which codebase.
BetterStack mapping example:
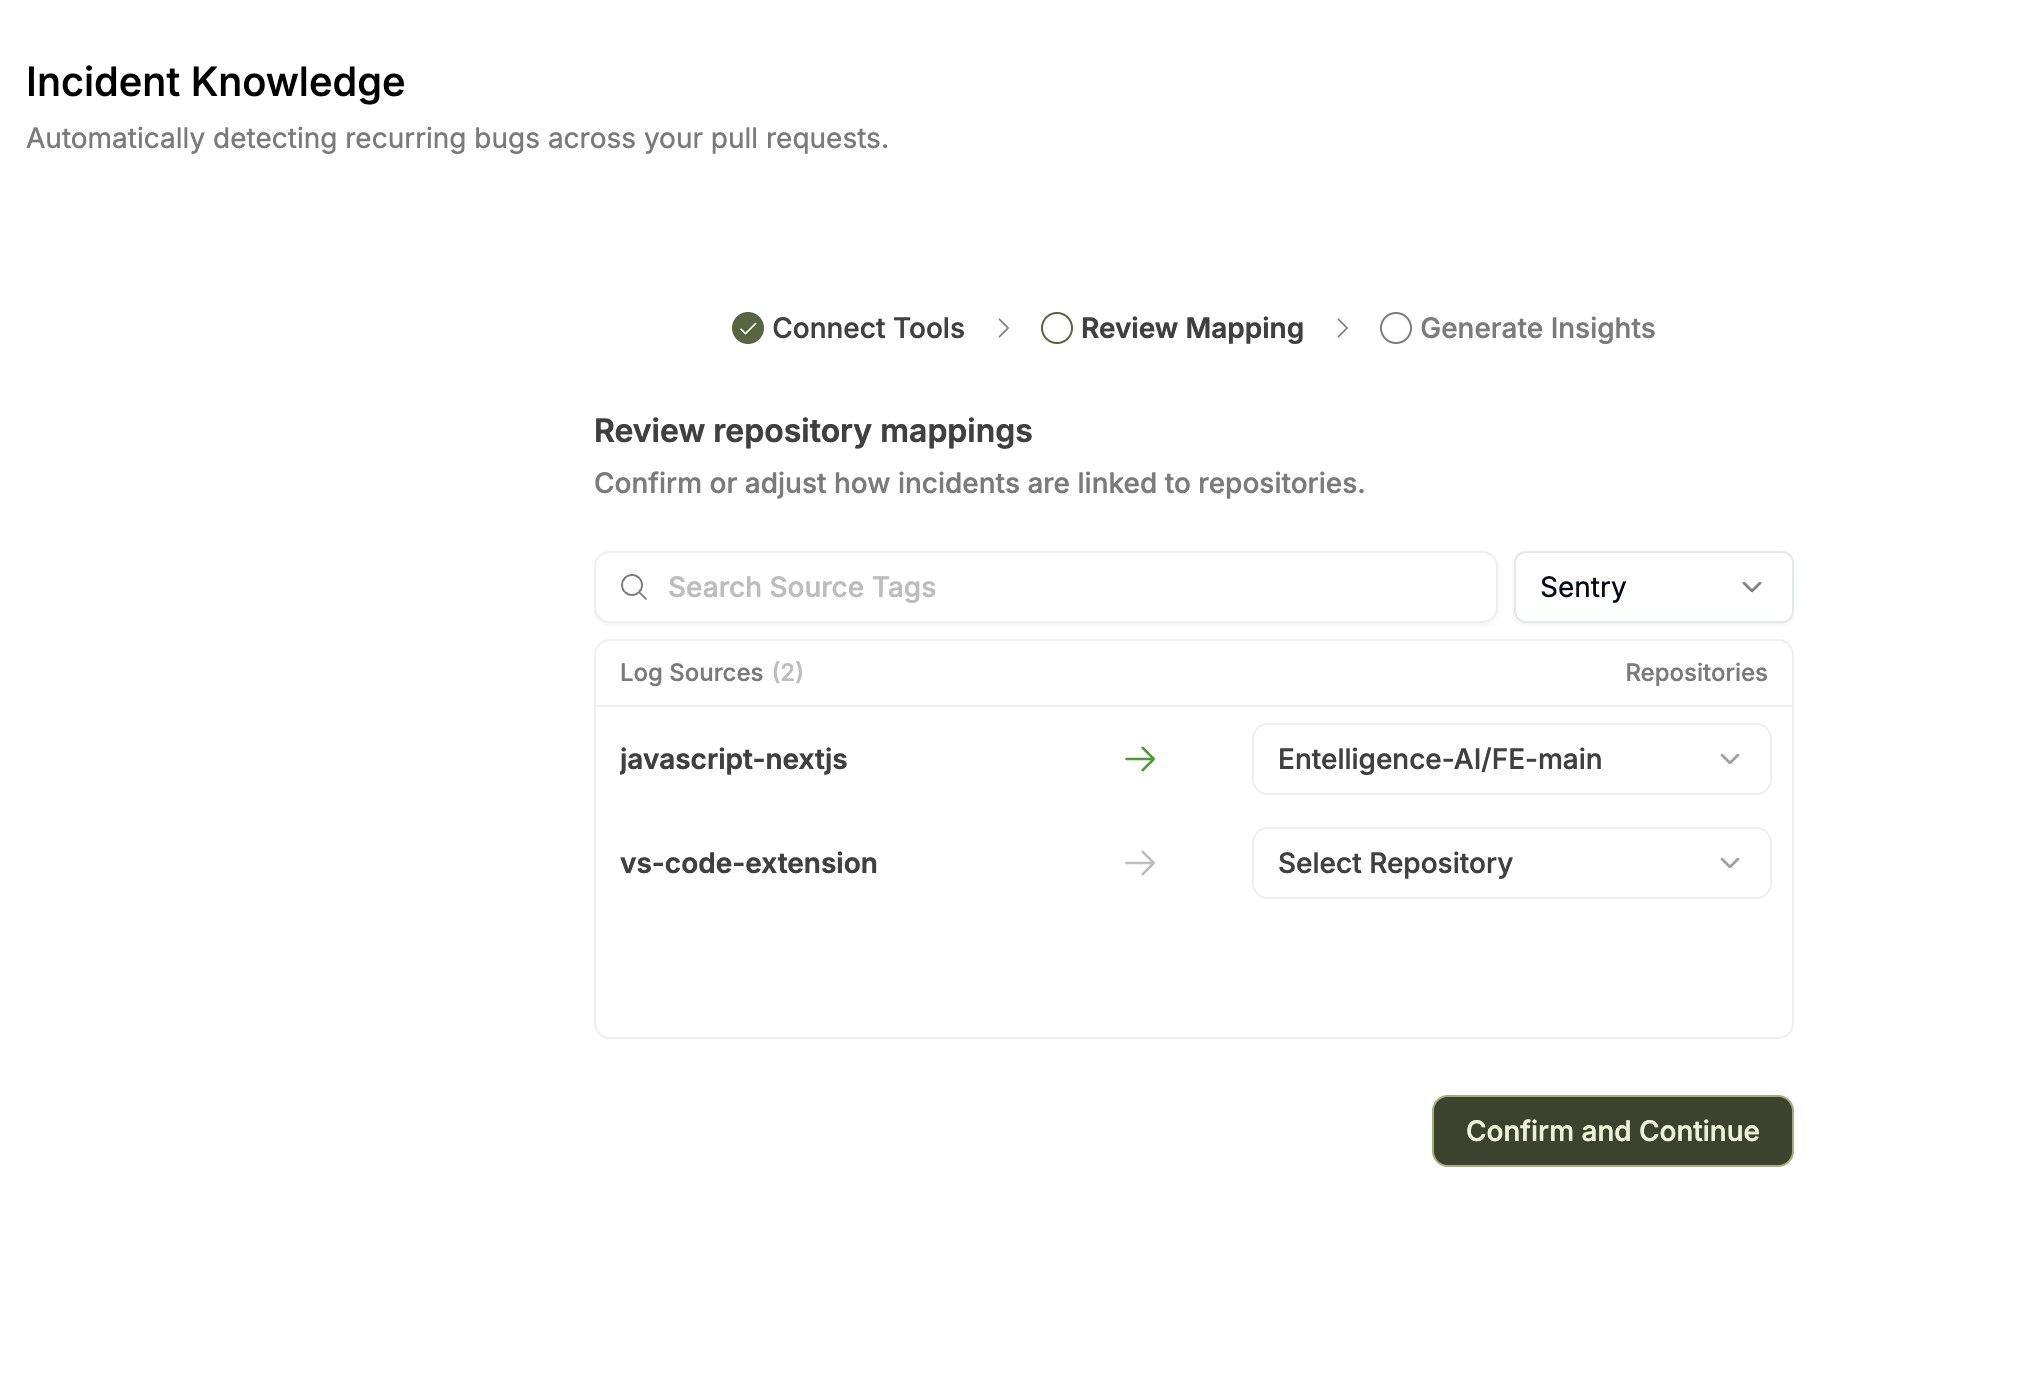
Sentry mapping example:
How to review mappings:
- Each row shows a source from your incident platform (e.g., a Sentry project named
javascript-nextjs) - Use the Repository dropdown on the right to select the corresponding GitHub repository
- Use the search field to filter sources by name
- Use the platform filter (top right) to switch between connected platforms
- Leave a source unmapped (
Select Repository) if it is not relevant to any repository
A green arrow indicates a row is mapped; a gray arrow means it is unmapped.
When you are satisfied, click Confirm and Continue to save the mappings and start the ingestion.
Mappings can be updated at any time. Re-running ingestion after updating mappings will refresh the pattern analysis.
Step 3 — EKU Ingestion
After confirming mappings, Entelligence starts the EKU (Entelligence Knowledge Unit) ingestion process. This runs in the background and typically takes 20–30 minutes depending on your pull request volume.
During ingestion, the system performs three stages:
| Stage | What happens |
|---|---|
| Repository mapping indexed | Your source-to-repo mappings are saved and the repositories are queued for analysis |
| Analyzing historical PRs | Entelligence scans merged pull requests and correlates them with incident data |
| Generating recurring patterns | The AI identifies cross-PR patterns and clusters them into actionable knowledge |
You can close the browser during ingestion — it runs server-side. Come back to the Incident Knowledge page to check the status.
If ingestion fails, an error message will be shown with details. You can restart ingestion from the dashboard using the Re-generate button.
Mapping projects with Entelligence repositories
The source mapping links incident platform projects to Entelligence-managed GitHub repositories.
Supported platforms for source mapping
The following platforms expose named sources (projects, services, monitors) that can be mapped:
| Platform | Source type |
|---|---|
| Sentry | Projects |
| Datadog | Services / monitors |
| New Relic | Applications / entities |
| BetterStack | Monitors / uptime checks |
PagerDuty does not support source-level mapping. Incidents ingested from PagerDuty are associated with the entire organization, not individual repositories.
Updating mappings after setup
If you add new projects to your incident platform or onboard new repositories, you will need to re-run the mapping step:
- Navigate to Incident Knowledge
- Click the Re-generate button in the top right of the dashboard (or append
?onboarding=trueto the URL to reopen the wizard) - Update any new source-to-repository mappings
- Confirm to trigger a new ingestion run
EKU Ingestion reference
The EKU ingestion pipeline processes your incident and pull request data into actionable patterns.
What triggers ingestion
- Completing the onboarding wizard for the first time
- Clicking Re-generate on the Incident Knowledge dashboard
- Updating source mappings and confirming
Ingestion statuses
| Status | Meaning |
|---|---|
in_progress | Ingestion is running |
completed | Analysis is done; patterns are available |
failed | An error occurred; check the error message |
What gets analyzed
- Merged pull requests associated with mapped repositories
- Incidents from connected platforms within the configured lookback window
- Correlation between PR diffs and incident timelines
Viewing results
Once ingestion is complete, the Incident Knowledge dashboard shows:
- Overview tab — weekly trends, top patterns, common themes, and a breakdown by repository
- Learned Patterns tab — a full table of all detected recurring patterns with severity, frequency, and the PRs that contributed to each pattern
Each pattern can be expanded to see the specific code clusters and flagged PRs that were identified.
Troubleshooting
I don't see the Incident Knowledge page in the sidebar
The feature is behind a feature flag. Contact your Entelligence account manager to have it enabled for your organization.
My sources aren't showing up in the mapping step
- Verify your API credentials have the correct read permissions (see per-platform instructions above)
- Check that the integration shows as Connected in Settings → Integrations → Observability
Ingestion failed with an error
- Confirm your API keys are still valid and haven't been revoked
- Check that at least one source-to-repository mapping is saved
- Retry using the Re-generate button on the dashboard
Patterns aren't showing after ingestion
- Ingestion needs enough historical data. Make sure your repositories have merged pull requests and your incident platform has recorded incidents in the past
- Check the Last synced timestamp on the dashboard to confirm ingestion completed
I need to change my repository mappings
Navigate back to the mapping step by appending ?onboarding=true to the Incident Knowledge URL, or click Re-generate which reopens the configuration flow.